
BCG Matrix is mainly used by companies to analyse the performance of their multiple products and for decision making. Companies with very large product portfolios have one major issue – Which product to put money in and which product to take money out of? This question is answered by the BCG Matrix.

Definition of BCG Matrix
The BCG matrix is a matrix designed by the Boston Consulting group back in 1970’s. It is a Matrix which helps in decision making and investments. It divides a market on the basis of its relative growth rate and market share and comes up with 4 Quadrants – Cash cow, Stars, Question marks and Dogs. Products may be categorized in any one of the quadrants and the strategies for these products are decided accordingly.
This analysis actually helps you in deciding which entities in your business portfolio are actually profitable, which are duds, which you should concentrate on and which gives you a competitive advantage over others.
Once you know which businesses stand where in your business portfolio, you also come to know which businesses need investments, which needs harvesting (making money), which needs divesting (reducing investment) and which needs to be completely taken out of the business portfolio.
For a major organization like HUL, ITC etc which have multiple categories and within the categories, they have multiple lines of products, the BCG analysis becomes very important. At a holistic level, they get to make a decision on which product to continue and which product to be divested. Which product can give new returns with good investment, and which products are reaching the apex of market share.
Building the BCG Matrix
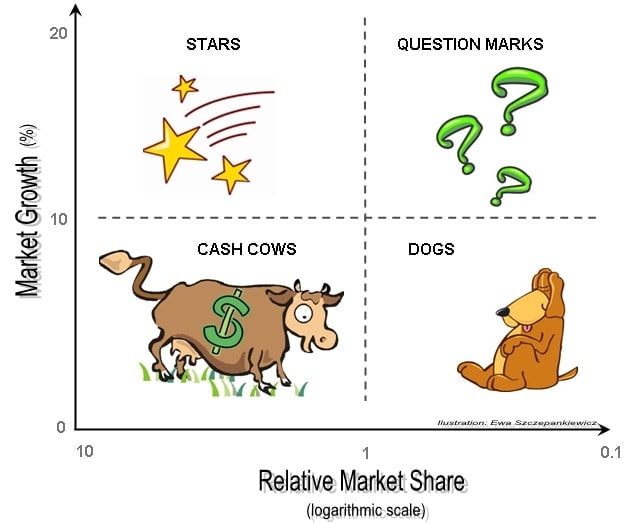
The BCG growth-share matrix was developed by Henderson of the BCG group in 1970s. There are two axis in the BCG matrix. The X-axis which is the relative market share and the Y-axis which is the Market growth rate.
- X-Axis – Relative Market Share – The market share of the business / SBU / Product in the market as compared to its competitors and overall product/category.
- Y-Axis – Market growth rate – The growth rate of the industry as a whole is taken into consideration from which the growth rate of the product is extrapolated. This growth rate is then pitched on the graph.
Thus by having 2 basic but at the same time very important factors on X axis and Y axis, the BCG matrix makes sure that the classifications are concrete.
RELATED TOPIC Marketing Strategy of UPS - UPS Marketing Strategy
Calculating the Market growth rate comprises of both industry growth and product growth rate thereby giving a fair knowledge of where the product / SBU stands in comparison to the Industry.
The market share, on the other hand, comprises of the competition and the product potential in the market. Thus when we consider growth rate and market share together, it automatically gives us an overview of the competition and the industry standards as well as an idea of what the future might bring for the product.
BCG Matrix Quadrants
Once the businesses have been classified, they are placed into four different quadrants divided into:
- Cash Cows – High market share but low growth rate (most profitable).
- Stars – High market share and High growth rate (high competition).
- Question marks – Low market share and high growth rate (uncertainty).
- Dogs – Low market share and low growth rate (less profitable or may even be negative profitability)
On the basis of this classification, strategies are decided for each SBU / Product. Let’s discuss the characteristics and strategies of each quadrant in detail.
1) Cash Cows
The cornerstone of any multi-product business, cash cows are products which are having a high market share in a low growing market. As the market is not growing, that cash cow gains the maximum advantage by generating maximum revenue due to its high market share.
Thus for any company, the cash cows are the ones which require least investment but at the same time give higher returns. These higher returns enhance the overall profitability of the firm because this excess revenue can be used in other businesses which are Stars, Dogs or Question marks.
Strategies for Cash cow in the BCG Matrix
The cash cows are the most stable for any business and hence the strategy generally includes retention of the market share. As the market is not growing, acquisition is less and customer retention is high. Thus customer satisfaction programs, loyalty programs and other such promotional methods form the core of the marketing plan for a cash cow product / SBU.
2) Stars
The best product which comes in mind when thinking of Stars is the telecom products. Stars are products with high market growth rate but low market share. Thus, there is a lot of competition in this segment.
If you look at any top 5 telecom company, the market share is good but the growth rate too is good. Thus because these two factors are high, the telecom companies are always in competitive mode and they have to juggle between investment and harvesting vis investing money and taking out money time to time.
Unlike cash cows, Stars cannot be complacent when they are top on because they can immediately be overtaken by another company which capitalizes on the market growth rate. However, if the strategies are successful, a Star can become a cash cow in the long run.
Strategies for Stars in the BCG Matrix
All types of marketing, sales promotion and advertising strategies are used for Stars. This is because in cash cow, already these strategies have been used and they have resulted in the formation of a cash cow. Similarly in Stars, because of the high competition and rising market share, the concentration and investment needs to be high in marketing activities so as to increase and retain market share.
3) Question Marks
Question marks are products which may have high market share and high market growth, but the market of the product is in question – whether it will grow further or decline.
An example of Question marks is desktop computers. More and more smartphones and laptops are being adopted. Desktops are still products with good market share and possibly growth. However, we have no idea till when the growth will continu. Another innovation down the line can completely kill Desktop computers.
Many times, a company might come up with an innovative product which immediately gains a good growth rate. However, the market share of such a product is unknown. The product might lose customer interest and might not be bought anymore in which case it will not gain market share, the growth rate will go down and it will ultimately become a Dog.
On the other hand, the product might increase customer interest and more and more people might buy the product thus making the product a high market share product. From here the product can move on to be a Cash Cow as it has lower competition and high market share. Thus
This uncertainty gives the quadrant the name “Question Mark”. The major problem associated with having Question marks is the amount of investment which it might need and whether the investment will give returns in the end or whether it will be completely wasted.
BCG Matrix Strategies for Question marks
As they are new entry products with high growth rate, the growth rate needs to be capitalized in such a manner that question marks turn into high market share products.
New Customer acquisition strategies are the best strategies for converting Question marks to Stars or Cash cows. Furthermore, time to time market research also helps in determining consumer psychology for the product as well as the possible future of the product and a hard decision might have to be taken if the product goes into negative profitability.
4) Dogs
Products are classified as dogs when they have low market share and low growth rate. Thus these products neither generate high amount of cash nor require higher investments.
However, they are considered as negative profitability products mainly because the money already invested in the product can be used somewhere else. Thus over here businesses have to take a decision whether they should divest these products or they can revamp them and thereby make them saleable again which will subsequently increase the market share of the product.
RELATED TOPIC Four key elements of Marketing
BCG Matrix Strategies for Dogs
Depending on the amount of cash which is already invested in this quadrant, the company can either divest the product altogether or it can revamp the product through rebranding/innovation/adding features etc.
However, moving a dog towards a star or a cash cow is very difficult. It can be moved only to the question mark region where again the future of the product is unknown. Thus in cases of Dog products, divestment strategy is used.
Success and Disaster Sequence in the BCG Matrix
Success Sequence
The Success sequence of BCG matrix happens when a question mark becomes a Star and finally it becomes a cash cow. This is the best sequence which really gives a boost to the companies profits and growth. The success sequence, unlike the disaster sequence, is entirely dependent on the right decision making.
Disaster sequence
Disaster sequence of BCG matrix happens when a product which is a cash cow, due to competitive pressure might be moved to a star. It fails out from the competition and it is moved to a question mark and finally, it may have to be divested because of its low market share and low growth rate. Thus the disaster sequence might happen because of wrong decision making. This sequence affects the company as a lot of investments are lost to the divested product. Along with this the money coming in from the cash cow which is used for other products too is lost.
BCG Matrix Strategies
There are four strategies possible for any product / SBU and these are the strategies which are used after the BCG analysis. These strategies are
1) Build
By increasing investment, the product is given an impetus such that the product increases its market share. Example – Pushing a Question mark into a Star and finally a cash cow (Success sequence)
2) Hold
The company cannot invest or it has other investment commitments due to which it holds the product in the same quadrant. Example – Holding a star there itself as a higher investment to move a star into a cash cow is currently not possible.
3) Harvest
Best observed in the Cash cow scenario, wherein the company reduces the amount of investment and tries to take out maximum cash flow from the said product which increases the overall profitability.
4) Divest
Best observed in case of Dog quadrant products which are generally divested to release the amount of money already stuck in the business.
Thus the BCG or Boston matrix is the best way for a business portfolio analysis. The strategies recommended after BCG analysis help the firm decide on the right line of action and help them implement the same.
https://www.marketing91.com/bcg-matrix/
https://www.marketing91.com/bcg-matrix/


